#!/usr/bin/env python
# -*- coding: utf-8 -*-
import tkinter as tk
from tkinter import filedialog as fd
from math import *
x = 0
def main():
class AppUI(tk.Frame):
def __init__(self, master=None):
tk.Frame.__init__(self, master, relief=tk.SUNKEN, bd=2)
self.menubar = tk.Menu(self)
menu = tk.Menu(self.menubar, tearoff=0)
self.menubar.add_cascade(label="Program", menu=menu)
menu.add_command(label="Wyjście", command = self.quit)
menu = tk.Menu(self.menubar, tearoff=0)
self.menubar.add_cascade(label="Wykres", menu=menu)
menu.add_command(label="Zapisz jako *.ps", command = self.saveAsPs)
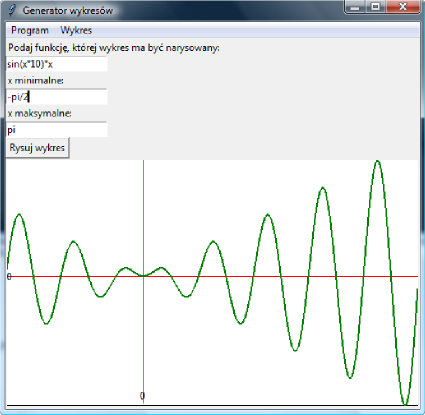
self.l_equation = tk.Label(window, text = "Podaj funkcję, której wykres ma być narysowany:")
self.l_equation.pack(anchor = tk.NW)
self.e_equation = tk.Entry(window)
self.e_equation.insert(0,"sin(x)")
self.e_equation.pack(anchor = tk.NW)
self.l_xmin = tk.Label(window, text = "x minimalne:")
self.l_xmin.pack(anchor = tk.NW)
self.e_xmin = tk.Entry(window)
self.e_xmin.insert(0, "-pi")
self.e_xmin.pack(anchor = tk.NW)
self.l_xmax = tk.Label(window, text = "x maksymalne:")
self.l_xmax.pack(anchor = tk.NW)
self.e_xmax = tk.Entry(window)
self.e_xmax.insert(0, "pi")
self.e_xmax.pack(anchor = tk.NW)
self.b_draw = tk.Button(window, text="Rysuj wykres", command = self.draw)
self.b_draw.pack(anchor = tk.NW)
self.c_draw = tk.Canvas(window, width = 500, height = 300)
self.c_draw.pack(anchor = tk.NW, expand = tk.YES, fill = tk.BOTH
)
try:
self.master.config(menu=self.menubar)
except AttributeError:
# master is a toplevel window (Python 1.4/Tkinter 1.63)
self.master.tk.call(master, "config", "-menu", self.menubar)
def saveAsPs(self):
filename = fd.asksaveasfilename(parent = self.master, filetypes = [('postscript', '.ps'), ('all files', '.*')], initialfile = "wykres.ps")
if filename:
f = open(filename, "w")
f.write(self.c_draw.postscript())
f.close()
def draw(self):
self.c_draw.delete("all")
global x
xmin = 0.
xmax = pi
height = self.c_draw.winfo_height() - 6
width = self.c_draw.winfo_width() - 2
self.c_draw.create_rectangle([0,0,width + 2,height + 2], fill="white")
try:
xmin = eval(self.e_xmin.get())
except:
xmin = 0
try:
xmax = eval(self.e_xmax.get())
except:
xmax = pi
if xmax < xmin:
xmax, xmin = xmin, xmax
elif xmax == xmin:
xmax = xmin + pi
step = (xmax - xmin) / width
l = []
for i in range(width):
x = xmin + i * step
try:
y = eval(self.e_equation.get())
except:
y = 0
l.append((x - xmin) * width / (xmax - xmin) )
l.append(- y)
l2 = l[1::2]
ymin = min(l2)
ymax = max(l2)
if ymin == ymax:
if ymin < 0:
ymax = 0
elif ymax > 0:
ymin = 0
else:
ymin = -1
ymax = 1
l3 = []
for i in zip(l[0::2],l[1::2]):
l3.append(i[0])
l3.append((i[1] - ymin) * height / (ymax - ymin) + 2)
self.c_draw.create_line([0, - ymin * height / (ymax - ymin) + 2, width, - ymin * height / (ymax - ymin) + 2], fill="red", width=1.0)
self.c_draw.create_line([- xmin * width / (xmax - xmin), 0, -xmin * width / (xmax - xmin), height], fill="blue", width=1.0)
self.c_draw.create_line(l3, fill="green", width = 2.)
self.c_draw.create_text([5, -ymin * height / (ymax - ymin) +2],text="0")
self.c_draw.create_text([-xmin * width / (xmax - xmin), height - 10], text="0")
window = tk.Tk()
window.title("Generator wykresów")
app = AppUI(window)
app.pack()
window.mainloop()
return 0
if __name__ == '__main__':
main()